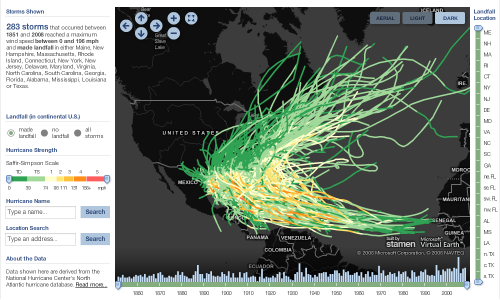
Last week we released a Historical Hurricane map for msnbc.com, a follow up to our forecast tracker from last year which was recently accepted into the SIGGRAPH Information Aesthetics showcase. You can read more about the historical map on the Stamen site, or just go ahead and explore the finished thing:
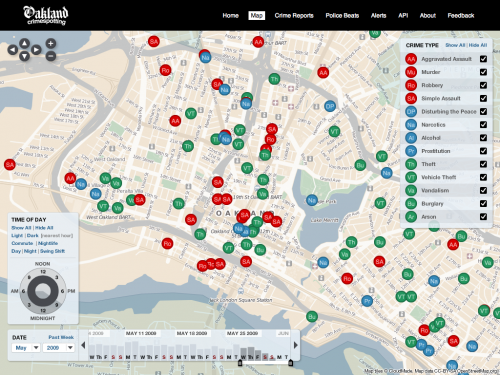
Further to our updates earlier last month, we just released another round of improvements to Oakland Crimespotting. Mike and Eric have full details. I'm particularly pleased that we're able to open up our archive of around two years worth of data, but also that we're able to try something new with an interface for filtering by time of day.
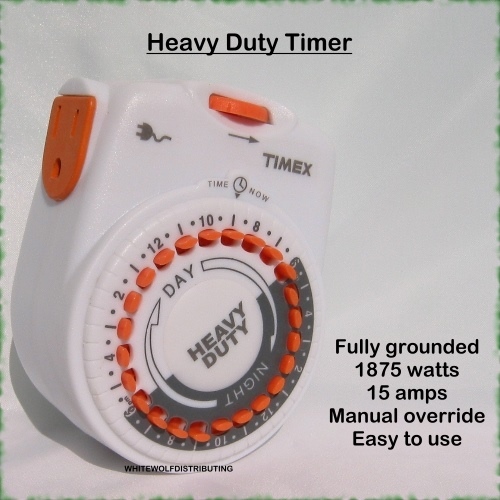
We jokingly started calling this a time pie, and now we're stuck with it... in a good way. I'm still not 100% sure it's intuitive, but I think that working the real sunrise and sunset times in there should help. The only comparable interface I could find was this:

If you know of any other similar ways of selecting/filtering 24 hours, let me know in the comments!

